
Oh hello there…
Below you can check out our guide on 10 restaurant key performance indicators (KPIs) and how you can measure them.
As a restaurant owner, there are a plethora of metrics that you can track over time to gauge how well your restaurant is performing.
The thing with the restaurant trade is that there are so many moving parts, if you don’t get a handle on what drives your business, your restaurant can be eaten alive by out of control costs, staff and customers.
1 – Overhead costs
Overhead costs are both fixed and variable costs, usually paid monthly or quarterly that you must pay to continue running your restaurant.
Keeping a firm eye on overhead costs is key to running a successful restaurant — examples of overhead costs below.
Rent or mortgage payments
Business rates
Utilities (Water, Gas, Electricity)
Waste removal
Management overhead / Head office
Insurance
Accountants, stock takers and cleaners
Software subscriptions (like TableYETi)
Repairs and maintenance
Supply of cleaning materials
Marketing
Staff training and benefits
These costs should account for no more than 30% of your revenue, and you’ll see later on in this post why that is the case.
To measure overheads as a KPI, you want to track the total spend monthly. You can record it as a cash value and as a % of monthly revenue.
2 – Dish and drinks costs
Food and drink are one of the most critical aspects of your restaurant (please notice, I didn’t say it was the most critical). Along with being essential to why your customers return, they’re going to be one of the most significant costs to the business.
Plus if you think about it, it is always going to be a balance between price and quality, a tightrope even, that walked correctly can bring great success, and stepped wrongly can mean falling to your death.
Dish costs are to be calculated in the following way, the total cost of ingredients for a dish are added together, this gives you the dish costs. Example below
Fish and Chips
Cost of batter £0.20 + cost of cod £3.00 + cost of chips £0.50 + cost of mushy peas £0.80 + cost of tartar sauce £0.30.
Total = £4.80
You should note, that you’ll be using a % of the total cost of an item. For example, you don’t buy batter by the portion; you’ll either buy it by the tub or make your own. To calculate this cost, you divide the total cost of a container of batter £20.00 by the number of servings contained, 100 giving you £0.20 per dish.
Drinks cost are calculated in the same way. The total cost of a bottle divided by the number of portions it contains and any extra costs associated with that drink. Example below.
Single Gin and Fevertree Tonic
25ml Gin £0.53 + Fevertree Tonic £1.00 + Ice £0.05 + Lime slice £0.10 + Paperstraw £0.20
Total = £1.88
Small tip, a 70cl bottle of Gin have 28 shots of gin, so you divide the cost of the bottle by 28 to get the cost of a single shot.
The total costs of all food and drinks served, shouldn’t account for more than 25% of your total restaurant cost. Again, you’ll find out why later in the post.
To measure dish and drinks’ cost as a KPI, you want to take the total amount spent on the cost of ingredients in one month and divide it by the number of dishes and drinks that were served that month. Keep drinks and dishes as two separate numbers.
You also want to track the % cost of ingredients vs revenue as a KPI.
3 – Gross profit margin
Gross profit is the cost of goods sold vs revenue. If your calculating your costs of drinks and dishes accurately, then calculating your gross profit margin shouldn’t be too complicated.
The significant addition to your cost calculation here is the variable cost of non-salaried staff. Waiters, bartenders, barbacks, kitchen porters and cooks if non-salaried should all be included in gross profit. The reason these are included in Gross Profit is that they rise and fall with demand.
Gross profit calculation below.
£10,000 spent on goods sold + £5000 spend on variable cost of service = £15,000 gross expenditure on revenues of £100,000. Giving a gross profit of £85,000 (Revenue minus gross expenditure)
Then to calculate the gross profit percentage, gross margin is divided by revenue then times 100. In this case that would be £85,000 / £100,000 x 100 giving 85% gross profit.
As a restaurant owner, you should be aiming for a gross profit of a min 70%. You’ll see why very shortly.
To measure gross profit as a KPI, you would track the gross profit percentage monthly.
4 – Net profit margin
Before we move towards calculating net profit, you may have also seen the word EBITDA and wondered what that means. The acronym stands for Earnings before interest, taxes, depreciation, and amortization and is very merely your net profit before taxation.
Ok, moving on after clearing up the above, below is how to calculate Net Profit.
Net profit is the account of monies left after all costs. You add your gross expenditure to your overhead costs and deduct this from your revenue. Example below.
£15,000 gross expenditure plus £40,000 overhead cost equals £55,000 on revenues of £100,000, you then deduct £55,000 from your revenue of £100,000 to give you a net profit of £45,000.
Again you can express this as a %; you divide the £45,000 by the £100,000 and times 100 which gives you a net profit of 45%.
Now you can see why we said that you should keep your overheads at no more than 30% of revenue and ingredients at no more than 25% of revenue. Then when you add in another 5%/10% gross expenditure, you’ll have a net profit of around 40%.
40% is a fantastic net profit for a restaurant; realistically you’d be doing exceptionally well if you achieved 25% and many restaurants survive on 15%.
Another critical point to take into account here is that net profit isn’t cash and that is why it is good to aim for a higher net profit %, so all your money doesn’t end up being tied up in stock. Having additional cash means that you can expand your restaurant empire.
To measure net profit as a KPI, you would track the net profit percentage monthly.
5 – Rate of employee turnover, or employee churn
The average employee costs you three months of salary until they’re completely integrated into the team and up to speed with your business and processes. I could write a whole blog post on how to onboard staff quicker and more effectively, but I’ll save that for another day.
So if you’re spending three months salary on each new employee, it is essential to track how many of them leave and how long the average employee stays working for your restaurant.
To calculate employee turnover you need to know how many employees left the company in 12 months and how many people you employ on average. Example, if you employ 100 people and ten people leave each year, you’d have an employee churn rate of 10% per year.
To measure employee churn as a KPI, you’d want to calculate your monthly employee churn rate. (1/12 of your yearly rate).
6 – Returning customer percentage
There currently isn’t a simple way to track how many of your customers return, but there are some solutions which will allow you to follow this most important KPI. List of solutions below.
Booking platform
Loyalty schemes
Some discount platforms
TableYETi (restaurant intelligence)
All of the above services will give you an idea of what % of your guests are returning. If you want to calculate it yourself, the formula is the total number of returning guests divided by the total number of covers in a given period. Example below.
One hundred covers of which ten come back each month, your monthly returning customer rate is 10%.
You may also want to calculate average guest visits per month, to figure this, you need to know how many times an individual customer returns each month. The calculation would be the number of visits divided by the number of visitors.
If you have 200 visits by 100 visitors, you know the average guest attends your restaurant twice per month.
To measure returning customer percentage and average visits per guest as a KPI, you’d want to calculate your returning customer and average visit percentage each month.
7 – Net Promotor Score
The most important indicator of the success of any business is the Net Promoter Score. The score is calculated based on the answer to a straightforward question, how likely would you be to recommend ‘insert your restaurant’ to a friend or colleague? And the guests answer on a scale of 1-10 with one being bad and ten being incredible.
Scoring is based on the following assumption, guests who score 9 or 10 are promotors, 7 or 8 are classed as passives, and anyone that scores 6 or under is a detractor.
Then to calculate the Net Promoter Score, you need first to find out your % of promoters and % of detractors. The below chart will help.
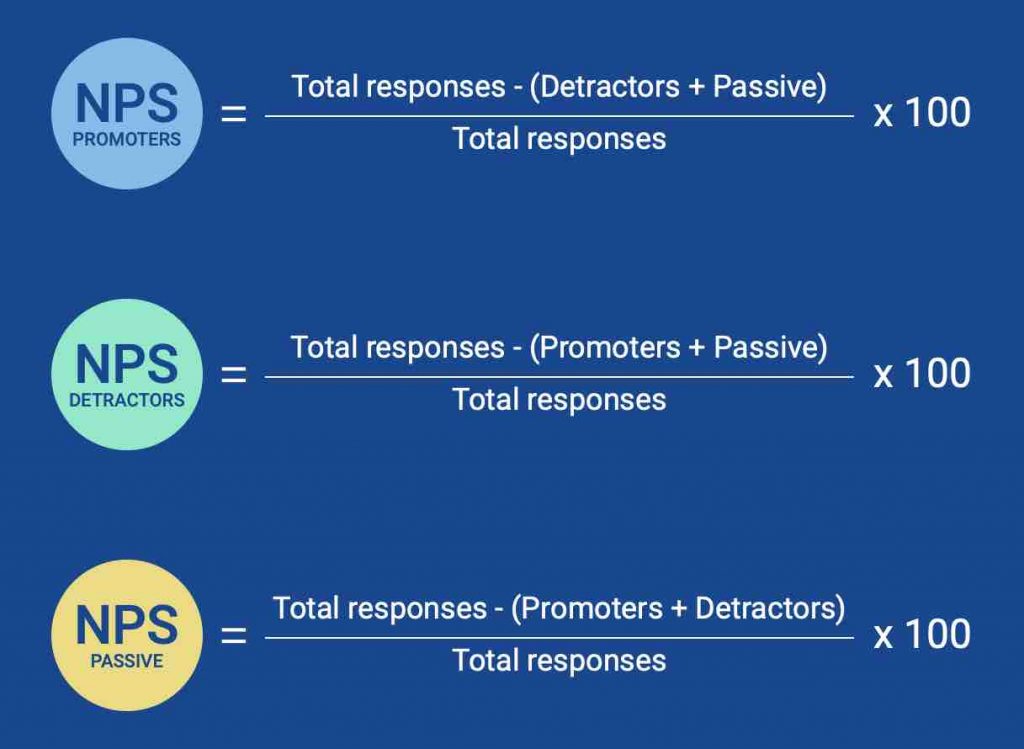
Once you have the % of promoters and % of detractors, you deduct the detractors from the promoters. Example below.
90% promoters minus 8% detractors will give an NPS of 82. 82 would be a world-class score.
To measure NPS as a KPI, you’d want to calculate your NPS score based on data each month. P.s TableYETi can make this simple for you.
8 – Average revenue per guest
This is an important statistic to measure and improve over time. It is also one of the easiest to calculate. It is the total revenue divided by the total number of guests. Example below.
You have revenue of £100,000 and 1000 guests attend your restaurant to generate this revenue; this would give you an average revenue per guest of £100.
What’s great about tracking this number is that you can run experiments to see if you can improve the average. For example, you could add a more expensive share dessert to the dessert menu or train your staff to offer an apéritif to guests as they arrive. We’ll do another blog post on how to improve your average revenue per guest soon.
To measure the average revenue per guest as a KPI, you should calculate and record the average cash amount each month.
9 – Average revenue per table
Easy to calculate, difficult to improve, as you only have a certain number of tables and hours in the day. Where it is true that the tactics you implement to grow average revenue per guest will have a positive effect on average income per table, to make a significant gain in average revenue per table you need to be smart. TableYETi smart.
Turning your tables quicker will lead to the most significant gains in average revenue per table. Imagine that you can squeeze in one more table turn each evening, and each table turn brings you an extra £150 in revenue on average.
If you have 50 tables, that’s an extra £7500 per day or £2,737,500 per year. Yes, that’s nearly £3m additional revenue. Now I know that is an extreme example, but even an extra £1000 per day could be the difference between massive success and an average one.
TableYETi can help your guests leave on average 10 minutes quicker, click here to find out more.
To calculate average revenue per table, you take the total revenue and divide it by the number of table turns you’ve made to generate that revenue in your restaurant. Example below:
£100,000 revenue, 10,000 table turns, would be £100 average revenue per table.
To measure the average revenue per table as a KPI, you should calculate and record the average table revenue amount each month.
10 – List of KPIs to track
Way to go, you’re now well on the way to running a more efficient and profitable restaurant. Below is a list of the KPIs you should measure each month and a link to a handy spreadsheet to help you record them.
Overhead cash value
Overhead % of revenue
Average dish cost
Average drink cost
The average total cost of ingredients vs revenue
Gross profit cash
Gross profit %
Net profit cash
Net profit %
Employee churn rate
Returning customer %
Average visits per customer
Net Promoter Score
Average revenue per guest
Average revenue per table
If you’d like more quality content from TableYeti subscribe to our blog below.
Similar post you might like

Upcoming Event Ideas
Upcoming Event Ideas “Navigating the Post-Pandemic Hospitality Landscape”: This discussion could delve into changes brought by the COVID-19 pandemic, and strategies hospitality businesses have used
Making social media work for hospitality in 2023, with Simon Squibb.
PRE-REGISTER BELOW Join us for an exclusive one-hour session with Simon Squibb, a renowned entrepreneur, business mentor, and social media expert with over 1 million
Ready to get started with TableYeti?
Speak to one of our device at table payment experts today and learn how the Yeti can drive a significant return on your investment in us.